LogDNA Adds Kubernetes Metrics Support
LogDNA announced today it has added support for Kubernetes events and resource metrics to its namesake log management platform for applications that can be deployed in the cloud or on-premises.
Peter Cho, vice president of product management for LogDNA, says the goal is to make it easier for developers to troubleshoot Kubernetes environments alongside all the other platforms that LogDNA already supports.
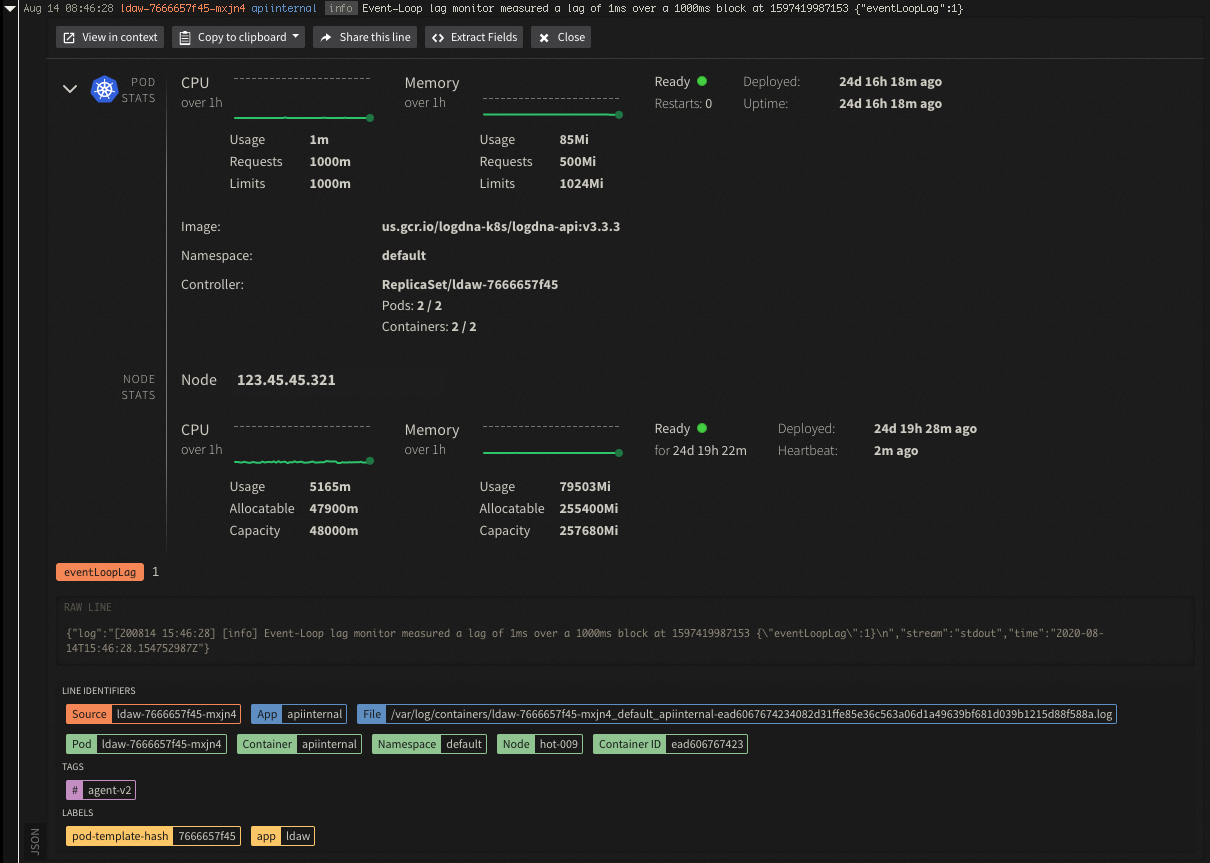
Kubernetes events and resource metrics related to a specific service can now be viewed alongside application logs. That capability empowers developers to troubleshoot and resolve deployment issues without requiring them to have specialized knowledge of Kubernetes tooling.
Unlike log management platforms designed primarily for IT administrators, LogDNA is making a case for a log management platform aimed at developers. IT environments have become complex to the point where a log management platform is an absolute requirement to achieve observability, says Cho. However, many organizations can’t afford a dedicated site reliability engineer (SRE) and need an approach to log analytics that developers can easily navigate on their own, he notes.
LogDNA provides developers access to log analytics that can be accessed via a command-line interface (CLI) or user interface.


It’s not clear whether or how much IT organizations may be willing to replace legacy log management platforms. However, as more organizations embrace best DevOps practices that include observability as a core tenet, LogDNA is betting that a different approach to log management will gain additional traction as developers assume more responsibility for managing IT environments.
In general, Cho says, any effort to achieve observability needs to start with log analytics, as the log is the atomic unit for observability.
Given the inherent complexity of Kubernetes, opportunities for mistakes to be made are rife. Misconfigurations of Kubernetes clusters abound because of the numerous settings options Kubernetes enables. Rather than waiting for those issues to be encountered later, Cho says LogDNA makes it easier for developers who have deployed Kubernetes to discover those types of issues sooner on their own.
Most IT operations teams will not be giving up their existing log management tools anytime soon. However, the more tools that developers can employ to troubleshoot IT environments, the fewer issues those IT operations teams may need to dive into later.
Whether a transition to DevOps will push organizations to rethink their overall approach to log management is unclear. However, there are lots of greenfield deployments of Kubernetes applications that are managed mainly by developers who have little appreciation for tools based on graphical user interfaces (GUIs) that they would prefer not to have to learn how to employ. Most of them would rather have an approach to log analytics that becomes a natural extension of their existing DevOps workflows versus relying on a tool designed for an IT administrator that can’t actually solve the problem.