7 Open Source Cloud-Native Tools For Observability and Analysis
In 2021, ‘observability’ is close to gaining buzzword status. This is perhaps because, for years, monitoring wasn’t as standardized in software development. Tracing was given less forethought, and applications produced logs in varying formats and styles. Without unifying layers to analyze a growing number of services, this led to a chaotic mess of jumbled application analysis.
Now, with cloud-native technology, engineers aren’t trying to repeat these mistakes from the past. Also, with increased user expectations and digital innovations demands, there is now more focus on maintaining overall stability, performance, and availability. This has given rise to the growth of observability and analysis tools. These open source projects are making logs more actionable, tracing events with detailed metadata, and exposing valuable metrics from Kubernetes environments. Such insights can inform business metrics, help pinpoint bugs and spur quick recovery measures. For these reasons, deep observabilty across the cloud-native application stack is a must.
So, below we’ll explore six well-established CNCF projects related to observability, telemetry and analysis. Many of these projects help collect and manage observability data such as metrics, logs and traces.
1. Prometheus
The popular monitoring system and time series database


 Prometheus is the most popular graduated CNCF project related to observability and likely needs no introduction, as many engineers are already familiar with it. Large companies such as Amadeus, Soundcloud, Ericsson and others already use Prometheus to power their monitoring and alerting systems.
Prometheus has built-in service discovery and functions by collecting data via a pull model over HTTP. It then stores metrics organized as time-series key-value pairs. These metrics can be customized to the application at hand and set to trigger alerts — for example; an e-commerce site may need to identify slow load times to stay competitive. Prometheus has great querying abilities; the PromQL query language can be used to search data and generate visualizations.
A Prometheus environment is comprised of the main Prometheus server, client libraries, a push gateway, special-purpose exporters, an alert manager and various support tools. To get started, developers can review the getting started guide here.
2. Jaeger
Open source, end-to-end distributed tracing
![]() With the move toward distributed systems, the process of debugging, networking and supporting observability for many components has become exponentially more challenging. Jaeger is one project that aims to solve this dilemma; it’s designed to “monitor and troubleshoot transactions in complex distributed systems.” According to the documentation, its features are as follows:
With the move toward distributed systems, the process of debugging, networking and supporting observability for many components has become exponentially more challenging. Jaeger is one project that aims to solve this dilemma; it’s designed to “monitor and troubleshoot transactions in complex distributed systems.” According to the documentation, its features are as follows:
- Distributed context propagation
- Distributed transaction monitoring
- Root cause analysis
- Service dependency analysis
- Performance/latency optimization
Jaeger works by implementing various APIs for retrieving data. This data follows the OpenTracing Standard, which organizes traces into spans; each span details granular details like the operation name, a start timestamp, a finish timestamp and other metadata. Jaeger backend modules can export Prometheus metrics, and logs are structured using zap, a logging library.
3. Fluentd
A unified logging layer
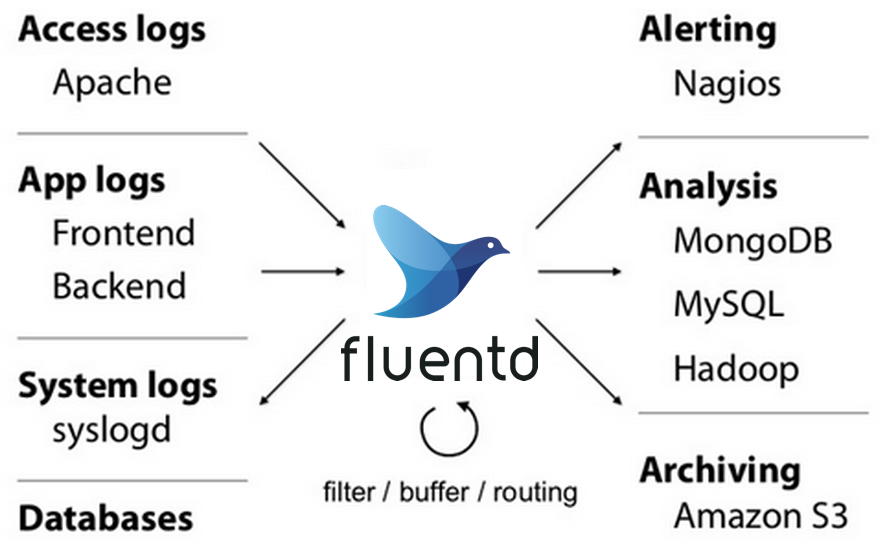
Fluentd is a logging layer designed to be decoupled from backend systems. The philosophy is that a Unified Logging Layer can rid the chaos of incompatible logging formats and disparate logging routines.
Fluentd can track events from many sources, such as web apps, mobile apps, NGINX logs and others. Fluentd centralizes these logs and can also port them to external systems and database solutions, like Elasticsearch, MongoDB, Hadoop and others. To enable this, Fluentd sports over 500 plugins. Using Fluentd could be helpful if you need to send out alerts in response to certain logs or enable asynchronous, scalable logging for user events.
To get started with Fluentd for logging, one can download it here for any operating system or find it on Docker. Once installed, Fluentd offers a graphical UI to configure and manage it.
4. Thanos
Highly available Prometheus setup with long-term storage capabilities
![]() For those that want to get more out of Prometheus, Thanos is an option. It’s framed as an available metric system with unlimited storage capacity that can be placed on top of existing Prometheus deployments. Using Thanos to obtain a global view of metrics could be helpful for organizations that use multiple Prometheus servers and clusters. Thanos also enables extensions to your own storage of choice, making data retention theoretically limitless. As Thanos is designed to work with larger amounts of data, it incorporates downsampling to speed up queries.
For those that want to get more out of Prometheus, Thanos is an option. It’s framed as an available metric system with unlimited storage capacity that can be placed on top of existing Prometheus deployments. Using Thanos to obtain a global view of metrics could be helpful for organizations that use multiple Prometheus servers and clusters. Thanos also enables extensions to your own storage of choice, making data retention theoretically limitless. As Thanos is designed to work with larger amounts of data, it incorporates downsampling to speed up queries.
5. Cortex
Horizontally scalable, highly available, multi-tenant, long-term Prometheus.
 Cortex is another CNCF project designed to work with multiple Prometheus setups. Using Cortex, teams can collect metrics from various Prometheus servers and perform globally aggregated queries on all the data. Availability is a plus with Cortex, as it can replicate itself and run on multiple machines. Like Thanos, Cortex provides long-term storage capabilities, with integrations for S3, GCS, Swift and Microsoft Azure.
According to the documentation, “Cortex is primarily used as a remote write destination for Prometheus, with a Prometheus-compatible query API.” To begin working with Cortex, check out the getting started guide here.
6. OpenTelemetry
An observability framework for cloud-native software.
![]() OpenTelemetry is a project built to collect telemetry data, such as metrics, logs and traces, from various sources to integrate with many types of analysis tools. The package supports integrations with popular frameworks such as Spring, ASP.NET Core, Express and Quarkus, making it easy to add observability mechanics to a project. Of note is that OpenTracing and OpenCensus recently merged to form OpenTelemetry, making this one powerhouse of an open source telemetry solution.
OpenTelemetry is a project built to collect telemetry data, such as metrics, logs and traces, from various sources to integrate with many types of analysis tools. The package supports integrations with popular frameworks such as Spring, ASP.NET Core, Express and Quarkus, making it easy to add observability mechanics to a project. Of note is that OpenTracing and OpenCensus recently merged to form OpenTelemetry, making this one powerhouse of an open source telemetry solution.
More Tools for Observability, Metrics, and Analysis
In today’s digital age, metrics are the lifeblood of a business. Having a holistic assortment of application performance data and end-user actions information is vital for analysis. But that’s not the only end goal — quality filtering and navigation for such data are just as crucial for turning stale metadata into actionable insights.
Above, we’ve covered some of the most adopted CNCF projects related to observability, monitoring, and analysis. But these aren’t the only options available — there is a lot more exciting development occurring within CNCF-hosted projects and the surrounding ecosystem.
At the time of writing, CNCF hosts the following projects in sandbox status. As you can see, these emerging projects involve more active monitoring, such as via chaos engineering and Kubernetes health checks, as well as deeper Kubernetes-first observability.
- Chaos Mesh: A chaos engineering platform for Kubernetes.
- Chaosblade: An easy-to-use and powerful chaos engineering experiment toolkit.
- Fonio: Data-first monitoring agent using (e)BPF built on RedBPF.
- Kuberhealthy: An operator for running synthetic checks as Kubernetes pods.
- Litmus: Chaos engineering in a cloud-native way.
- OpenMetrics: A de facto standard for transmitting cloud-native metrics at scale, evolving the Prometheus exposition format into a standard.
- Pixie: Open source Kubernetes observability.
- Skooner: Simple Kubernetes real-time dashboard and management.
- Trickster: HTTP reverse proxy cache and time-series dashboard.