Modernizing Legacy Applications: Technical Lessons
This is part two of lessons learned from modernizing legacy applications to a microservices architecture. You can check out part one here.
Part one focused on organizational lessons learned. This segment is more technical, and covers some of the challenges encountered when moving to Kubernetes/OpenShift-based microservices.
Here are the technical lessons shared in this article:
- Experiment with different microservices communication patterns before committing to any one.
- Use shadow releases the right way.
- Isolate performance testing for each microservice.
- Don’t confuse memory management between Java and Kubernetes.
- Prioritize contract testing over end-to-end testing for microservices.
- Don’t ignore the [connection] pools, but mind the queues.
- Complex distributed systems will fail – plan for it.
- Leverage best practices for Kubernetes health endpoints to achieve self-healing.
Lesson One: Experiment with Microservices Communication Patterns before Committing
In the second organizational lesson [link], we discussed how a small team should prepare microservices templates. The most notable long term consequence will be how those microservices talk to each other. Their own technology stack can evolve independently, but the paradigm in how they communicate is something that’s harder to change later. Experimenting early pays off.
Architectural options worth investigating include:


- Synchronous API calls between microservices, and waiting for the downstream calls to complete. This paradigm is reassuringly simple, and when moving from legacy technologies with so many moving parts, that simplicity might be its strongest benefit. Options include JSON over HTTP (simplest) or gRPC (smaller, faster and relying on HTTP/2).
- Reactive programming at a microservice level. This is a much more efficient way to design your service if you are going to be I/O-bound, waiting for multiple other services to complete. Instead of using a single thread for each downstream request, non-blocking I/O will leverage callbacks into the code and lead to much better resource utilization.
- Reactive programming at the overall system level (with one of the POC teams potentially leveraging frameworks such as Akka).
- A pub/sub architecture with technologies like Kafka. Scaling consumers reading from a shared message queue has multiple advantages, like easier elasticity to handle spikes and replaying traffic for testing. It’s worth trying this out, especially if a single request is divided into a high number of East/West sub-requests.
Lesson Two: Use Shadow Releases the Right Way
Does your test environment simulate the complete variance in production? Does it simulate the total traffic volume, the volume spikes, and the diversity of all requests? If you’ve answered yes to all questions, you are able to replay a realistic production load in a test environment. If not, a shadow release strategy will be invaluable. If done properly, a shadow release will catch the majority of problems you would find in production. Even though it delays turning on the lights, this lowers the risk tremendously, and assures that once turned on, they will stay on.
A shadow release is where the new system is deployed alongside the existing legacy application, while still using the legacy application for the production responses to client requests. The ingress traffic is duplicated to reach both the legacy system and the new system. Results from calling the new system are ignored and not relied upon to respond to production traffic, but can be stored and compared offline with the responses going out to production.
Two broad aspects need verification in a shadow release environment: 1) functionality (am I getting the correct responses?), and 2) reliability/performance (response time, system’s horizontal scaling and elasticity, error rate, etc).
For a shadow release to be truly useful, we recommend:
- Work up to mirroring 100% of the traffic. Start lower, sampling traffic, especially when sharing databases between the old and new systems. Ultimately, a 100% sampling rate is what will give you confidence that your solution can scale and handle traffic. Database backends should not be modifiable by the new microservices to avoid side effects.
- If there are concerns about shared databases preventing you from increasing the sampling rate for fear of affecting production, start by making the sampling dial configurable up/down/off live in production (please don’t inject the properties at build time — and if you do, have a separate way to turn the dial in production). Then, involve the database team and monitor the database load and response times as you increase the sampling dial. If the new microservices are read-only, consider the use of separate read-replicas for the database to isolate the new microservices’ traffic so you can be completely confident that you’re not impacting production.
- Monitor. This is a great opportunity to make sure your teams have the proper tools to troubleshoot production problems before they are actually used in production, reducing risk and increasing the speed of resolution of future issues.
- Compare production and shadow outputs. Either write quick-and-dirty comparison tools to see if the two flows return the same results, or manually sample the results and compare them.
Lesson Three: Isolate Performance Testing for each Microservice
In the past, legacy application performance was tested as a whole, from the perspective of the users’ requests: separate components to tests did not exist. In a microservices world, final system performance should be monitored, but it shouldn’t be the product teams’ focus for three main reasons: delayed feedback, complexity and lack of accountability.
Waiting for the whole system of microservices to be in a test environment creates coordination problems between teams, relies on a complex environment setup, and is slow to produce results. Worse, results lack clear actionable information about performance bottlenecks and regressions. If the orchestration-level first service is always responsible for the performance of the whole system, you’ll unfairly burden that team to be accountable for microservices that are the responsibility of other teams.
In a microservices world, performance testing needs to be done in isolation for each microservice. First, define service level objectives (SLOs) for all the services, leveraging meaningful service level indicators (SLIs). In the legacy application, you might have had a service level agreement (SLA) for each type of operation entering the monolith. Now each microservice (each endpoint) should have its own SLO. Here’s an example to illustrate the point: service A calls service B which then calls service C with a 99th percentile SLA of seven seconds for the whole system; you could define a SLO on A of five seconds, B of three seconds, and C of one second.
The idea here is to 1) have more aggressive internal SLOs than your published SLAs, and 2) instead of performance testing the whole system at once and not understanding what is going on, you can performance test A by virtualizing B, giving it a constant response time of three seconds. Then, A’s response time can be verified to be under that five-second threshold (virtualization solutions can also add random delays and simulate more varied performance profiles). Similarly, the team owning B can virtualize C at its SLO of one second, ensuring that B responds under three seconds. SLOs can then be further refined to include network latency.
This dependency on virtual services for performance testing improves the accountability and sanity of teams. It simplifies the dependencies on other services, and it can also help tremendously in automating the performance testing and shifting the activity left. Each team can become responsible for their own service performance instead of it being relegated to a later stage.
A few other lessons learned with regard to performance testing in a Kubernetes/OpenShift environment:
- To remove some variability in performance testing, you need to ensure that the CPU request and limit are set to the same value to compare a performance test result with a previous one. Otherwise, you have no idea how much CPU the service actually got in case of a congested node. The CPU limit is not guaranteed, only the request is.
- While setting the CPU limit and request to the same value is a good practice in the performance test environment, production settings can benefit from a higher CPU limit, if available. The CPU request of the production environment can match the values in the test environment to ensure SLO consistency, while increasing the CPU limit.
- Don’t stop at load testing the system: do stress tests to see when and how it starts breaking, and most importantly, how it recovers. Also, perform soak tests to run tests for a long period to rule out any subtle memory leaks or other long-term side effects.
Lesson Four: Don’t Confuse Memory Management Between Java and Kubernetes
There seems to be a lot of confusion about Kubernetes memory request and limit in application development teams. I think it’s because people tend to incorrectly map the new concepts to the Java memory settings: the start-up heap size is being confused with the pod requested memory, and the maximum heap size is thought to map to the pod memory limit. This is incorrect. Kubernetes will only guarantee that you have access to the requested amount of memory. The guarantee on the limit is that if you request more, the pod will be killed – it’s not a guarantee of availability up to that limit. Actually, the pod scheduler does not even look at the memory limit to schedule a pod on a particular node.
To reduce the moving parts and understand what is going on, I suggest an initial oversimplification to 1) set the Java heap start and max to be the same value (for example 3 GiB), and 2) set the pod request and limit to a higher value than the Java heap size, but the same number for both request and limit (for example 6 GiB). Many articles can help size the JVM heap size, but the extra memory at the pod level maps to the non-heap components of Java (stack frames, classloader, etc.). It also includes Java’s Direct Memory which is used for memory accessible not just by the JVM but also by the system, providing optimized IO, in certain cases. This was found to be used by Redis/Netty in our case, and complicated the understanding of the memory usage as being outside the JVM’s heap (it is controllable by using -XX:MaxDirectMemorySize).
In the longer term, there needs to be proper visibility in to the cost to run the microservices. If the product team is unaware of how much their service costs to run (in memory requirements, yes, but that also applies to compute and storage), the incentive loop to optimize operational cost can be nonexistent. These metrics need to be collected and available to the products team, helping to justify the value of spending time on that technical debt.
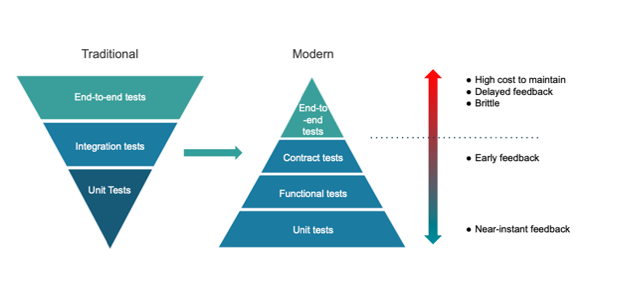
Lesson Five: Prioritize Contract Testing over End-to-End Testing for Microservices
How do you test a complex distributed system made of many parts? The traditional way is to have a full environment with all the services deployed in it, and perform end-to-end (E2E) testing in that environment. This forms a set of services at a specific version that become a potential deployable entity. There is an inherent paradox between the initial appeal to decouple microserves from each other, only to be able to confidently deploy the versions that have been verified to work with each other. The full advantages of innovating faster with a microservices architecture cannot be fully realized with traditional E2E testing.
Here are some other very painful limitations in using E2E testing:
- It provides delayed feedback from the time the code is committed, increasing the cost to fix issues.
- It is typically brittle and, as such, becomes very expensive to maintain.
- It requires a dedicated environment to run, which leads to teams waiting on each other (unless there is automation to create the environment).
This is where contract testing can have enormous benefits. The ability to test the interactions between two microservices in isolation initially sounds a little bit like black magic. In a nutshell, in the case of consumer-driven contracts, the core principle is that a consumer service (service A) describes and records its expected interactions with a mocked provider service (service B). The specific request from A to B, the response from B to A and any relevant state data to build that response are all recorded as a contract on the consumer (A) side. The provider (B) side can then replay the contract without A being online, and verifies that it respects the consumer expectations when it executes its real code.
A series of contracts in place provides confidence that services integrate correctly, without the services being up at the same time and requiring a separate environment to run. It shifts integration testing left by running these tests as early as possible. They can run on developers’ machines and also in the CI pipeline. Developers can make changes locally knowing that they are not breaking other services. In addition, the contracts can be tested across multiple versions of microservices, ensuring that a specific version of a microservice is compatible with a specific set of versions of other microservices. In a traditional approach, this would require setting up separate end-to-end environments for each permutation of microservices versions.
Contract testing is a great solution, but as with any change, what is most difficult is changing people’s habits. Giving up the mental comfort that the pieces are tested together in an E2E environment and trusting a new paradigm for testing is difficult. We suggest doing it along with whatever exists today in E2E testing; building trust in the new paradigm. E2E testing can start to be trimmed down at a later stage. It should still be used, but can then focus on testing that the microservices are wired together properly in that environment: Are the endpoints reachable all the way down? Is the authentication and authorization working? Are the certificates between the endpoints trusted and set up properly? E2E testing does not need to focus on testing the variance in functionality depending on the input.
Lesson Six: Don’t Ignore the [Connection] Pools, but Mind the Queues
Connection pools are everywhere, and will have serious consequences if misconfigured. A particularly dangerous problem arises when you don’t realize that your connection pool is too small because actions get put in a queue that is then emptied as the pool frees up.
These pools need to be reviewed and tested independently, with a close eye on the default configuration properties. Example of pools to be mindful of:
- The inbound connection pool – how many connections can your service handle concurrently?
- The default thread pool – how many threads can you use in your application? For example, in Java, parallel streams or CompletableFutures? These all have default thread pools that you want to customize to your usage pattern.
- Our favorite: the connection pool for outbound calls to downstream services. Most developers assume that if you do a call to a downstream service in an HTTP client, it will happen immediately and synchronously. But that’s not necessarily true: connection requests to downstream services might end up in a queue themselves. For example, ClosableHttpRequest in SpringBoot has a default of five maximum connections per route and 20 connections total – for the whole service! Delaying downstream processing is a bad choice, in general. Our recommendation is to customize those pool numbers so they are high enough not to delay downstream processing, without worrying about overwhelming the downstream services. It is their responsibility to scale up, and limiting the outbound connections will tend to hide the problem. If many opened connections are an issue on the caller’s side, then it should scale up – or revisit the initial architecture choices and consider reactive programming or a message queue.
Lesson Seven: Complex Distributed Systems Will Fail – Plan for It
In the legacy world, any error was a big enough deal to investigate and try to address. In the era of cattle and not pets, where increased complexity makes it more likely for things to fail (more network traffic; orchestration layer; pod scaling up and down, etc.), the error rate is what needs to be monitored, and a proper retry strategy needs to be implemented.
There are two main options for a retry strategy. Either use a service mesh or, alternatively, add the strategy explicitly in the code with frameworks such as Resilience4j (Hystric is end-of-life). If you know you’re eventually going to have a service mesh for all of its benefits (observability, security and reliability), it is acceptable to temporarily forgo the reliability benefits – as long as the rate of errors is under the SLA. You can also selectively add explicit retry strategies to the few places that would benefit most.
A word of caution on retry strategies: if you are already at the edge of your SLA, then, depending on when the failure occurs in the processing, the service may be unable to respond in a timely manner. That’s another reason why your SLOs should be much more aggressive than your external SLAs.
Lesson Eight: Leverage Best Practices for Kubernetes Health Endpoints to Achieve Self-Healing
The health endpoints are key to making the system resilient in the face of unexpected problems. They are also an opportunity to save time (and cost) by not shooting for near-perfection in reliability. Admitting that sometimes the services will fail is okay, as long as it can recover automatically with no adverse effect to end users. The way that this is achieved in Kubernetes/OpenShift is through the use of liveness and readiness probes. The liveness probe is used to restart the container if it fails more that its failure threshold, and the readiness probe is used to know whether or not to route traffic to that pod. Keep in mind that the liveness and readiness probes are completely independent. In other words, the liveness probe can fail, but as long as the readiness probe is successful then the traffic will be routed to the container (until the failure threshold of the liveness probe is reached, at which point the container will be killed).
As a best practice, there should be no assumption made on the health of the cluster, which means that the liveness and readiness probes need to support both a fast and slow startup of the container. Until Kubernetes 1.16, that created a dilemma: the only way to route traffic quickly after a fast startup time is to put a low initialDelay in the readiness probe. But to support a slow start of the container, the failureThreshold needs to be increased substantially, which delays reacting to problems in the service. Starting in Kubernetes 1.16, the startup probe can be leveraged to allow for long startup time before the liveness probe takes over and not overly pad the liveness and readiness probes. So, try to use the startup probe whenever possible.
Another consideration is being more aware of cascading effects in readiness probes. If a readiness probe tests its downstream services’ readiness probes, a transient issue might cascade to other services, thereby inactivating themselves. For that reason alone, a readiness probe should not test downstream services, but be limited to concerns under its direct control like finishing its startup process.
One last challenge: the default SpringBoot Actuator health endpoint does not test for the memory situation. So, if the functional endpoints need a particular amount of memory to respond properly, they might error out because there is not enough memory available (because of a memory leak or too many requests in flight consuming too much), while the health probes return that everything is well, in a perfect world. To improve the health endpoint and take into account the unavailability of memory, the first thought could be to check how much memory is left in the liveness probe. However, if the garbage collector behavior is unpredictable, a better workaround, in our opinion, is to attempt to allocate a substantial buffer in the liveness probe when it’s called (and not hold to it). If the allocation is successful, the liveness probe can return that it is alive. While not perfect and with slight overhead, it ensures that the microservice gets restarted automatically when the inability to allocate memory persists longer than the duration of the allowed failure threshold.
We hope these technical lessons learned are useful and help you in migrating your legacy applications to microservices. Don’t hesitate to ask questions or share your comments and best practices!