Sysdig Embraces Prometheus for Container Monitoring
Sysdig has announced it will be making greater use of container monitoring technologies developed under the auspices of the open source Prometheus project starting with release 3.0 of its software-as-a-service (SaaS) container monitoring platform.
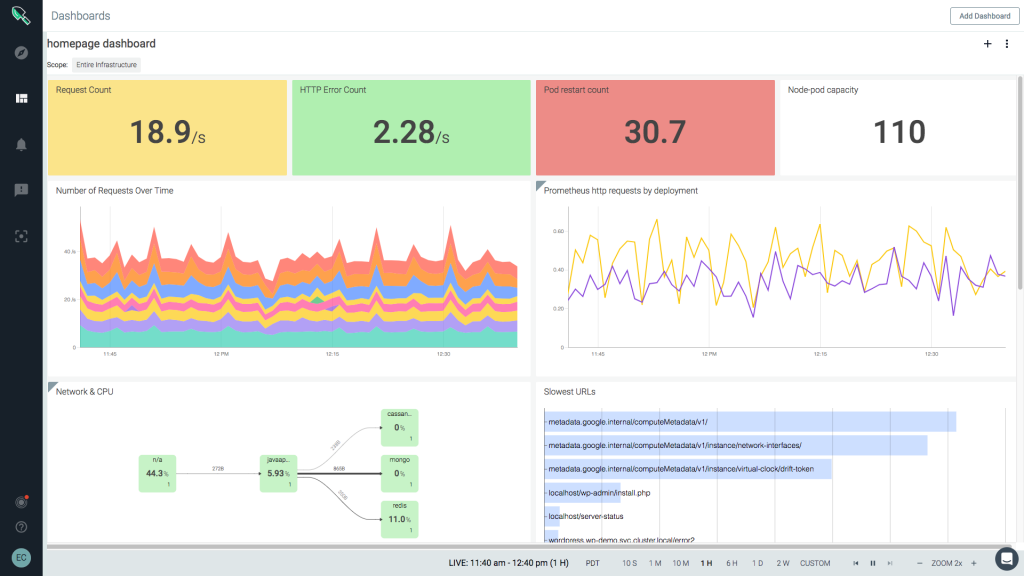
Eric Carter, director of product marketing for Sysdig Monitor, says Sysdig will continue to make use of its open source back-end engine for monitoring containers, but it also will support the Prometheus Query Language (PromQL) capabilities and Grafana user interface developed by under the leadership of the Cloud Native Computing Foundation (CNCF).
In addition, Sysdig Monitor 3.0 adds support for Kubernetes support, cluster management dashboards and StatefulSet metrics, which are generated by agent software running on a Kubernetes cluster.
In fact, Carter notes that Sysdig is now able to support all the major distributions of Kubernetes, including Pivotal Kubernetes Service (PKS), Kubernetes with Mesosphere DC/OS, Kubernetes with Docker 2.0, IBM Cloud Kubernetes Service, Amazon Elastic Container Service for Kubernetes (Amazon EKS) and Azure Container Service (AKS). As Kubernetes continues to gain momentum, he says, many enterprise IT organizations will soon find themselves needing to support two or more distributions of Kubernetes.
Carter says a similar scenario is also playing out monitoring tools. Many developers rely on open source Prometheus tools when developing their application. But IT operations teams tend to prefer a Sysdig approach to monitoring containers that is easier for IT administrators to both consume and ultimately act on. Support for PromQL means that DevOps teams will be able to launch queries against both the Prometheus and Sysdig backends as applications move from testing into deployment in a production environment, he notes.
The Sysdig platform can also process tens of millions of metrics per second and comes with commercial support provided by Sysdig, he adds.
It’s still early days in terms of Kubernetes adoption within the enterprise, but it’s already clear the potential for Kubernetes sprawl within IT environment is high. Most IT organizations have employed monitoring sparingly when managing legacy applications. But given the number of dependencies that likely soon will exist between multiple Kubernetes clusters running a wide variety of microservices based on highly ephemeral containers, it would seem container monitoring will become an absolute requirement.
Of course, IT organizations can avail themselves of managed instances of Prometheus. But Carter notes that in its present incarnation, each Kubernetes cluster requires its own instance of Prometheus. The amount of overhead generated by that approach is not likely to find favor in a production environment, he says.
Most IT operations teams are also not going to have much time to diagnose the source of any potential issue. As container environments are continuously updated, the need to resolve problems before they replicate across multiple clusters becomes a paramount concern.
Naturally, it will take time for IT operations teams to fully make the transition to highly dynamic container platforms. But the rate at which that transition occurs is likely to be determined by just how accessible the tools provided to those IT operations teams really are.


