Cluster Monitoring With Prometheus Operator
According to Sysdig’s container report, adoption of containers and usage of orchestration tools such as Kubernetes has grown more than 51% from 2018, to host and manage their workloads in the cluster. There is a significant need for an end-to-end cluster monitoring with detailed view on nodes, containers and pods, given their ephemeral states in cluster.
IT engineers need to reliably manage the applications and the cluster (nodes and data) and need to reduce manual effort in configuring the services, targets and data storage while monitoring every time the application goes off and comes back. This requires a seamless deployment and management of high-availability monitoring system such as Prometheus to cluster, where the dynamic configuration of scraping targets, service discovery and configuring rules for alerting for various targets in the cluster can be handled with an operator, and where the operational knowledge of IT engineer written as code using the operator pattern, thereby reducing manual intervention.
This article focuses on role of Prometheus Operator, how it works and how service monitoring works in Prometheus Operator to discover the targets and scrape the metrics.
Role of Prometheus Operator in Cluster Monitoring
- Enables seamless installation of Prometheus Operator with Kubernetes-native configuration options.
- Enables creating and destroying the Prometheus instance in the Kubernetes namespace, a specific application or team easily using the Operator.
- Enables to preconfigure configuration including versions, persistence, retention policies and replicas from a native Kubernetes resource.
- Enables to discover the target services using labels with automatic generation of monitoring target configurations based on familiar Kubernetes label queries.
Ex: Prometheus Operator can create new configuration file automatically, when the pods/services destroy and comes back, without manual intervention.
Components involved in Operator Pattern
- Custom Resource Definition (CRD) – creates a new custom resource with a name and schema that can be specified, without any programming. The Kubernetes API serves and handles the storage of the custom resource.
- Custom Resource – an object that extends the Kubernetes API or allows to introduce customized APIs into a kubernetes cluster.
- Custom controller – handles in-built Kubernetes objects, such as Deployment, Service in new ways, or manage custom resources as if they were native kubernetes components.
- Operator Pattern works with CRD and Custom Controller.
- Operator builds on Kubernetes concepts resources and controllers, which adds configurations that allows the operator to execute common application tasks.
- Operators are purpose-built resources to run a Kubernetes application, with operational knowledge baked in.
 Workflow of an Operator
The operator performs the following activities behind the scenes to manage the custom resources.


- Custom Resource Definition (CRD) creation – The CRDs define the spec and metadata, based on which the custom resources should be created with. When the request for CRD is created, the metadata is validated with the kubernetes internal schema types (OpenAPI v3 schema) and then creates the custom resource definition objects.

- Custom Resource creation validates the object against the metadata and the spec of CRD and accordingly creates the custom object creation.

- Operator (Custom Controller), starts watching for the events and its state changes and manages the custom resources based on CRD. It provides events to perform CRUD operations on the custom resource, so that whenever the status of the custom resource is changed, the appropriate event is triggered.

Service Discovery & Auto-configuration of Scraping Targets
Prometheus Operator uses Service Monitor CRD to perform auto-discovery and auto-configuration of scraping targets.
ServiceMonitoring involves the following components –
- Service – this is the actual service/deployment, which exposes metrics at a defined endpoint, port and identified with an appropriate label. Whenever the service or pod goes down, the service again comes back with the same label, hence making it to be discoverable by the service monitor. The services can reside in any namespace inside the kubernetes cluster.
- ServiceMonitor – the custom resource which discovers the services based on matching labels. The servicemonitor should reside in the namespace where the Prometheus CRD is deployed, however it can discover services deployed in other namespaces, using namespaceSelector.
- Prometheus CRD – matches the service monitor based on labels and generates the configuration for Prometheus
- Prometheus Operator calls the config-reloader component to automatically update the configuration yaml, which contains the scraping target details.

Let us take a sample use case to see how Prometheus Operator works to monitor the services.
Use Case: Gerrit Service Monitoring with Prometheus Operator
Gerrit is a code review tool used in the DevOps CI pipeline to gate the commits with a review approval process raised as the pull request.
This article assumes Gerrit is already running in Kubernetes cluster and does not cover the steps on how to run Gerrit as service in kubernetes.
If you do not have Prometheus Operator, use the helm chart to install it.
helm install stable/prometheus-operator.
The following components will be installed from default installation
- prometheus
- alertmanager
- node-exporter
- kube-state-metrics
- grafana
- service monitors to scrape internal kubernetes components
- kube-apiserver
- kube-scheduler
- kube-controller-manager
- etcd
- kube-dns/coredns
The below steps show how to enable Prometheus Operator to do auto-discovery of Gerrit service running in kubernetes cluster and scrape the metrics from Gerrit.
Expose metrics with Gerrit – Prometheus plugin
Gerrit metrics can be exposed using Prometheus plugin jar which needs to be installed in the Gerrit instance running.
- You can download the Prometheus plugin jar from. [https://gerrit-ci.gerritforge.com/] and place the jar at plugin directory of Gerrit [/var/gerrit/review_site/plugins/] and restart the gerrit service.
- Verify the Prometheus plugin in the admin web interface of Gerrit -> Plugins -> Prometheus plugin.
- Create an account and group to give access capability to view metrics.
- Log in to Gerrit web interface with an account with admin privileges, go to Projects>List>All-Projects. Click on the tab ‘Access’. Click on the button [EDIT].
- In the block Global Capabilities, click on Add Permission and Select the permission View Metrics in the drop-down list.
- Generate the token in Gerrit for the user.
- Select the group “Prometheus Metrics” we created above. Click on the button [Add]
- Go to the bottom of the page and click on the [Save Changes] button.

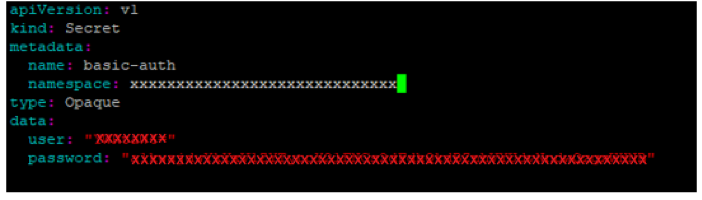
Create secret to access Gerrit service
- Once the token is generated in Gerrit, you can use the userid and token and generate encoded base 64 format of the user id and the token, to store the credentials in kubernetes secret.
- Create a yaml with the secret details and create the secret in kubernetes.
- kubectl apply -f gerrit-secret.yaml
Apply labels to service
Label the Gerrit service with the both the labels.
[For example: app: gerrit and release: prometheus-operator].kubectl label svc gerrit app=gerrit release=prometheus-operator
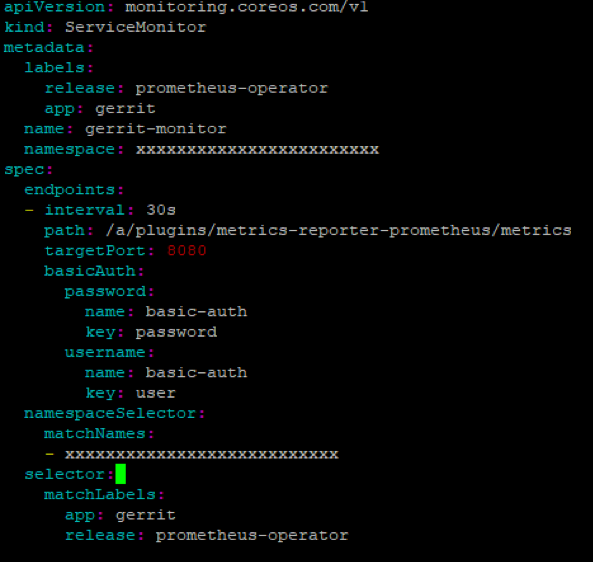
Create Service Monitor for Gerrit
Add the endpoint details in the servicemonitor to discover the Gerrit service metrics and the selector with matching labels as given below.
Service selector with label
- The labels under selector section refers to the label that is used to identify the service.
- Selector:
- matchLabels:
- app: gerrit
- release: prometheus-operator
ServiceMonitor selector
The labels under metadata section refers to the label that is used to identify the service monitor by Prometheus CRD.
Metadata:
labels:
app: gerrit
release: prometheus-operator
Namespaceselector: Provide the namespace in which the Gerrit service is running in Kubernetes cluster. The services can run under any namespace, but the service monitor should be created in the namespace where Prometheus Operator is running, so that Prometheus CRD can identify the service monitor object.
Match Service Monitor selector in Prometheus
Verify the service monitor selector section in the Prometheus object with the following command.
kubectl get prometheus
Match and apply the label as given in step 4b for the Prometheus object.
serviceMonitorSelector:
matchLabels:
release: prometheus-operator
Note: If Prometheus-operator is deployed with helm, the label release=Prometheus-operator is already applied to Prometheus object. We need to match this label in the service monitor as well, for the Prometheus CRD to identify the appropriate service monitor.
The above steps of servicemonitor creation can be done with prometheus-operator helm custom values.yaml as file.
Auto-discovery of Gerrit Service
Once the labels are updated, the Prometheus custom object will automatically call the config-reloader to read the endpoints and update the Prometheus configuration file. This is the primary benefit of using Prometheus-Operator, where there is no need of manual intervention of creating the Prometheus configuration file and updating the scraping configuration.
- Open the Prometheus url : http://prometheusip:nodeport
kubectl get svc prometheus – to get the nodeport details and replace the IP with the node details.
- Go to menu Status -> Configuration, to see the Prometheus configuration loaded automatically with the scrape configs.
Under scrape_configs section, the details of Gerrit service monitor can be seen, as given below.

- Go to menu -> Status -> Targets or Service Discovery menu. If the service monitor is successfully able to scrape the metrics of Gerrit, then the Targets should show as healthy [1/1 up].

Gerrit Health metrics in Grafana
Gerrit exposes various metrics such as JVM uptime, memory threads, heap size, errors, etc. which can be configured in Grafana dashboard as shown below to monitor the performance and health of Gerrit.
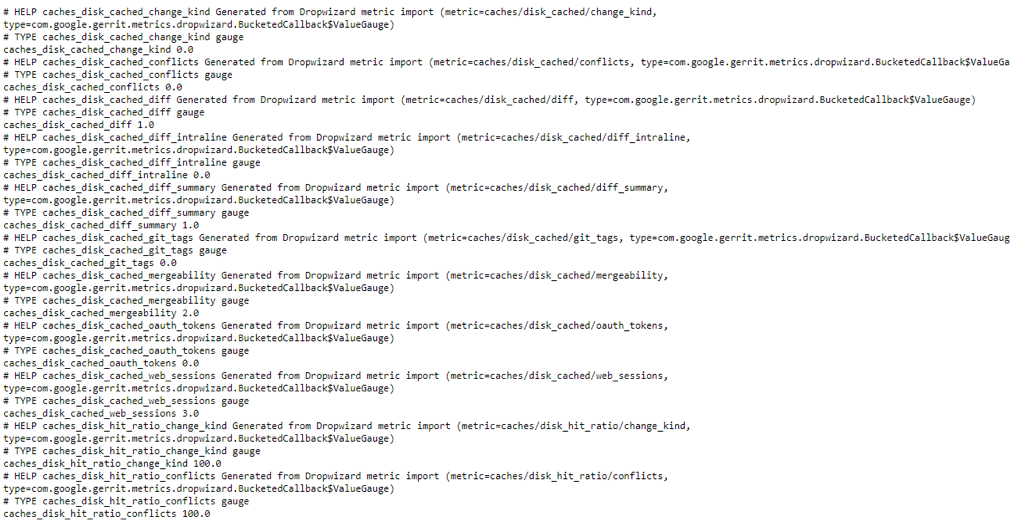
The Gerrit metrics are exposed under the following scrape url.
http://gerrit-svcip:nodeport/a/plugins/metrics-reporter-prometheus/metrics
kubectl get svc prometheus – to get the service node port.
Replace the gerrit-svcip, nodeport with the details of gerrit IP / nodeport of the gerrit service and the exposed metrics will be shown as given below.
The metrics values can also be evaluated in Prometheus -> Graph in the expression field
Ex: caches_disk_cached_git_tags
 The metrics can be configured in Grafana for monitoring the health of Gerrit. Select the datasource as Prometheus and configure widgets in the dashboards.
Some of the key metrics that can be configured are JVM_threads, Uptime, Http_Plugin errors, memory usage, events, etc.
Similar use cases such as application service health monitoring, devops tools health monitoring can be achieved with Prometheus Operator.
Prometheus Operator helps in seamless deployment and management of Prometheus, dynamic configuration of scraping targets, service discovery, scalability, with built-in SRE expertise which accelerates Cluster monitoring.