What is Service Mesh and Why Do We Need It?
In a microservices ecosystem, usually cross-cutting concerns such as service discovery, service-to-service and origin-to-service security, observability and resiliency are deployed via shared asset such as an API gateway or ESB. As a microservice grows in size and complexity, it can become more difficult to understand and manage.
Service mesh addresses these challenges where implementation of these cross-cutting capabilities is configured as code. A service mesh provides an array of network proxies alongside containers, and each proxy serves as a gateway to each interaction that occurs, both between containers and between servers. The proxy accepts the connection and spreads the load across the service mesh. Service mesh serves as a dedicated infrastructure layer for handling service-to-service communication.
Service mesh offers consistent discovery, security, tracing, monitoring and failure handling without the need for a shared asset such as an API gateway or ESB. So if you have service mesh on your cluster, you can achieve all the below items without making changes to your application code:
- Automatic load balancing.
- Fine-grained control of traffic behavior with routing rules, retries, failovers etc.
- Pluggable policy layer.
- Configuration API supporting access controls, rate limits and quotas.
- Service discovery.
- Service monitoring with automatic metrics, logs and traces for all traffic.
- Secure service to service communication.
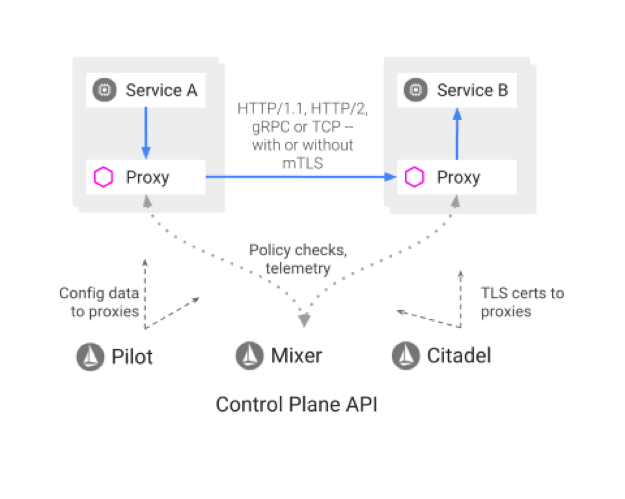
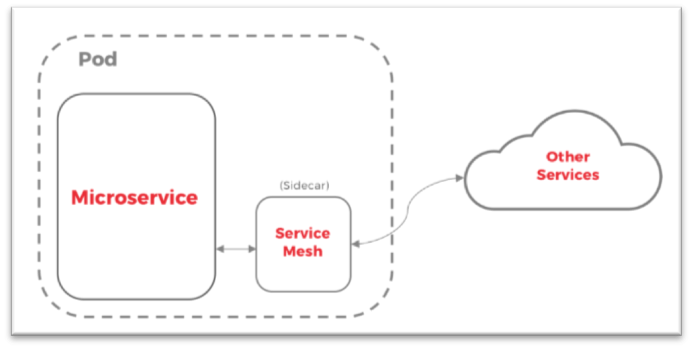
In a service mesh model, each microservice will have a companion proxy sidecar. The sidecar is attached to a parent application and provides supporting features for the application. The sidecar also shares the same life cycle as the parent application, being created and retired alongside the parent.


Key Use Cases for Service Mesh
- Service discovery: Service mesh provides service-level visibility and telemetry, which helps enterprises with service inventory information and dependency analysis.
- Operation reliability: Metrics data from service mesh allows you to see how your services are performing—for example, how long did it take it to respond to service requests and how much resource it is using. This data is useful to detect issues and correct them.
- Traffic governance: With service mesh, you can configure the mesh network to perform fine-grained traffic management policies without going back and changing the application. This includes all ingress and egress traffic to and from the mesh.
- Access control: With service mesh, you can assign policy that a service request can be granted only based on the location where the request came and can only succeed if the requester passes the health check.
- Secure service-to-service communications: You can enforce mutual TLS for service-to-service communications for all your service in mesh. Also you can enforce service-level authentication using either TLS or JSON web tokens.
Currently service mesh is being offered by Linkerd, Istio and Conduit providers. Service mesh is ideally for multicloud scenarios since it offers a single abstraction layer that obscures the specifics of the underlying cloud. Enterprises can set policies with the service mesh and have them enforced across different cloud providers.
In the next section, we look at how to implement Linkerd service mesh for the sample application we have used before—ngnix deployment.
Linkerd Service Mesh
Linkerd is a service sidecar and service mesh for Kubernetes and other frameworks. Linkerd sidecar is attached to a parent application and provides supporting features for the application. It also shares the same life cycle as the parent application, as it is created and retired alongside the parent.
Like explained above, enterprise applications and services often require related functionality such as monitoring, logging, configuration and networking services. Linkerd service mesh makes running your service easier and safer by giving you runtime debugging, observability, reliability and security all without requiring any changes to your code.
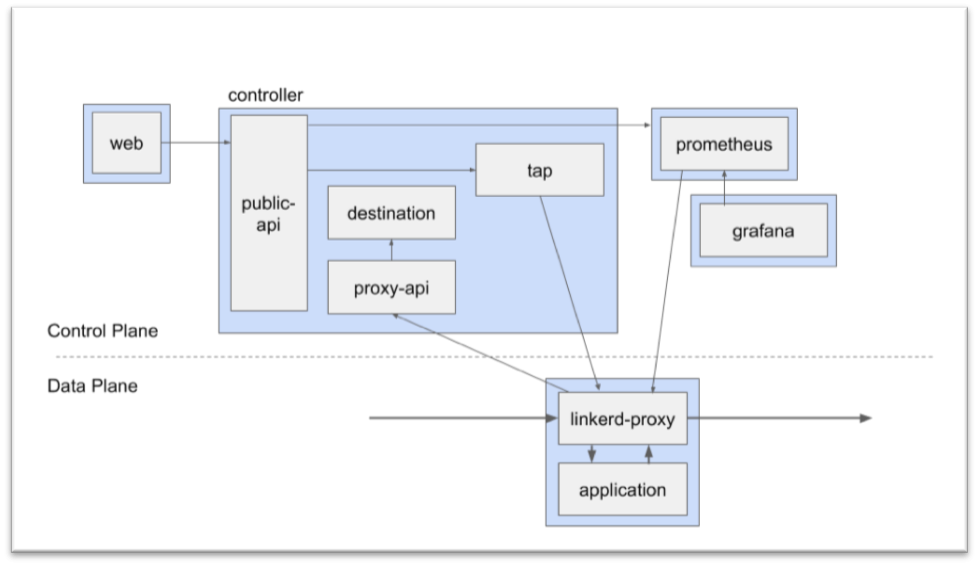
Linkerd Architecture
Linkerd has three basic components: user interface (both command-line and web-based options are available), data plane and control plane.
Key Components
- User Interface is comprised of a command line interface (CLI) (linkerd) and a web UI. The CLI runs on your local machine; the web UI is hosted by the control plane.
- Control plane is composed of a number of services that run on your cluster and drive the behavior of the data plane. It is responsible for aggregating telemetry data from data plane proxies.
- Data plane is comprised of ultralight, transparent proxies that are deployed in front of a service. These proxies automatically handle all traffic to and from the service.
Next steps, we will download and install Linkerd and deploy ngnix app.
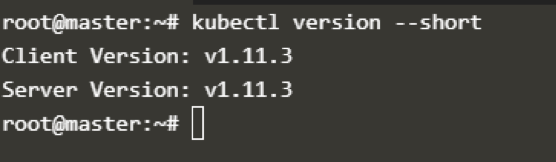
Step 1: Validate Kubernetes Version
Check if you’re running Kubernetes cluster 1.9 or later by using kubectl version command.
Step 2: Install Linkerd CLI
We will be using CLI to interact with Linkerd control plane; download the CLI onto your local machine using curl command.
You can also download the CLI directly via the Linkerd releases page.
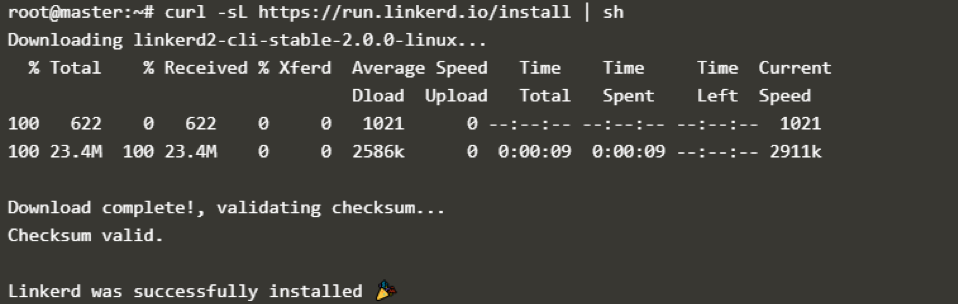
Verify if the CLI is installed and running correctly using linkerd command.

Step 3: Validate Kubernetes Cluster
To ensure that the Linkerd control plane will install correctly, we are going run pre check to validate that everything is configured correctly.

Step 4: Install Linkerd on the Kubernetes Cluster
We are going to install the Linkerd control plane into its own namespace using linkerd install command. Post installation, Linkerd control plane resources will be added to your cluster and start running immediately.

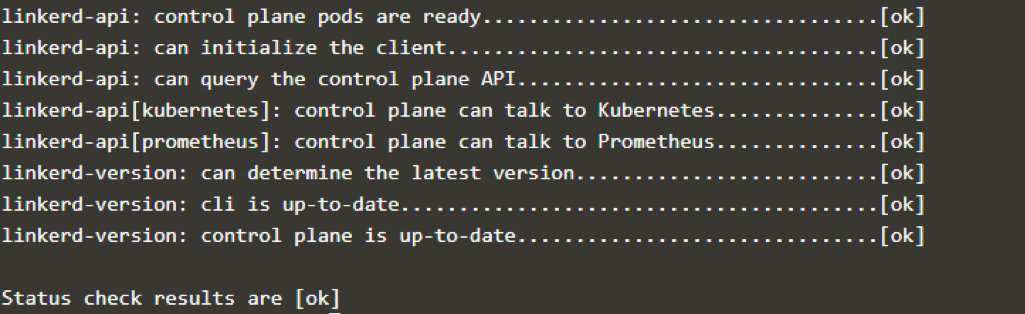
Post installation, run linkerd check to check if everything is ok.
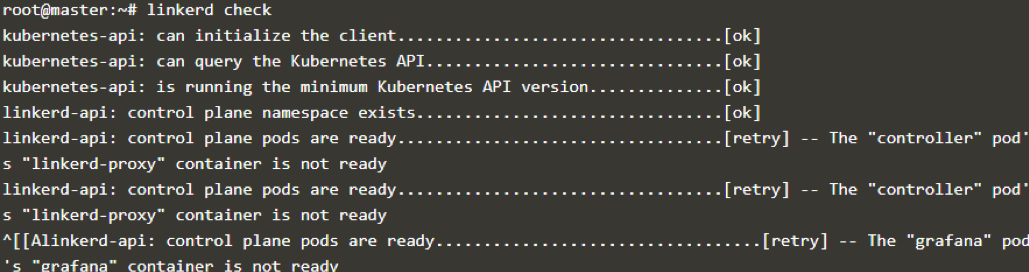
Post validation, you should be having [ok] status for all the items.
Step 5: View Control Plane Components
We have installed control plane and it’s running. To view the components of the control plane, use kubectl command.

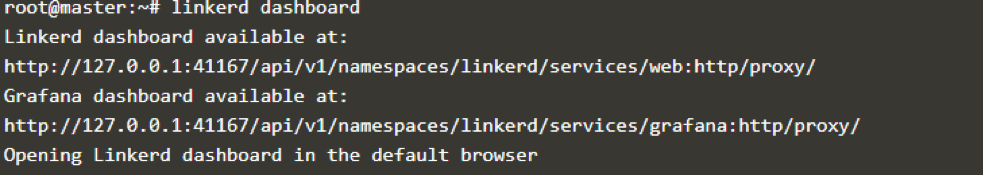
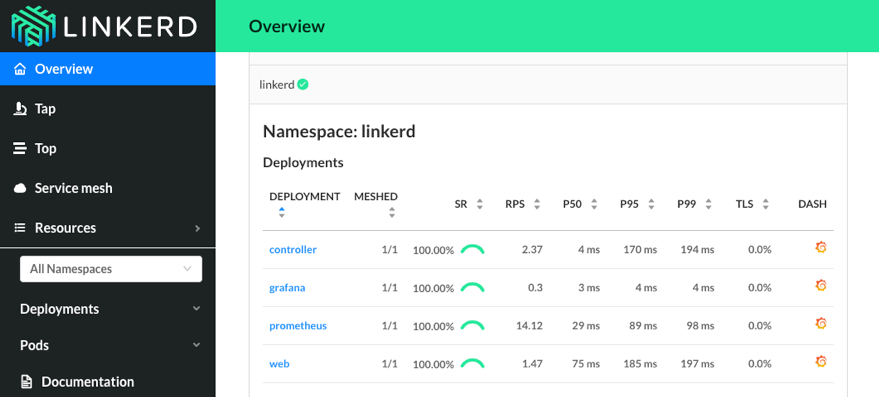
You can also view Linkerd dashboard by running linkerd dashboard.
To view traffic,use linkerd -n linkerd top deploy/web command.

Congrats! we have successfully installed and configured Linkerd components.
Next step is to set up a sample application and check the metrics.
Step 6: Check Deployment of a Sample App
We are going to reuse Ngnix web app deployment, so skip this step if you have already deployed.
To deploy, run kubectl apply command
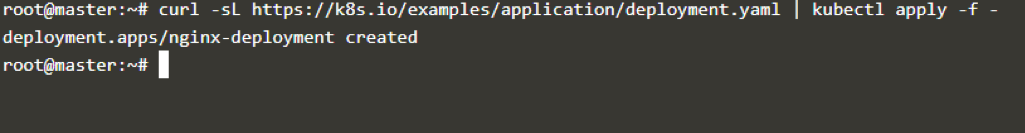
Now the application is installed, next step is to inject Linkerd to the app by piping linkerd inject and kubectl apply command. Kubernetes will execute a rolling deploy and update each pod with the data plane’s proxies, all without any downtime.

If you’ve noticed, we have added Linkerd to existing services without touching the original YAML.
To view high–level stats about the app, you can run linkerd -n ngnix-deployment stat deploy command.
The Linkerd dashboard provides a high-level view of what is happening with your services in real time. It can be used to view the “golden” metrics (success rate, requests/second and latency), visualize service dependencies and understand the health of specific service routes.
To view detailed metrics and actionable dashboards for your services, you can use Grafana dashboard, which is part of Linkerd control plane. It is possible to see high-level metrics and dig down into the details, even for pods.

Conclusion
In this post we have learned how to install Linkerd and its components. We have also deployed a sample service and saw how to view traffic and its metrics. There is much more to Linkerd and service mesh than what was covered here, but now you have a good idea of the basics of deploying service mesh. Keep exploring!
Additional Resources
- Kubectl cheat sheet
- Official documentation as a reference to understand any command
- If you’re looking for Kubernetes examples, here it is GitHub
- Linkerd Community
- Linkerd Documentation